Understanding the Research Graph
How LumaVista's agents plan, search, reason, and synthesize — and what the graph visualization shows you.

When you launch a research project in LumaVista, your question does not go to a single AI and come back as a single response. Instead, a team of specialized agents collaborates — each with a distinct role — to plan the research, gather information, analyze findings, and write a structured report. The research graph is the visual representation of all this work, and understanding it gives you insight into exactly how your research is being produced.
The agent team
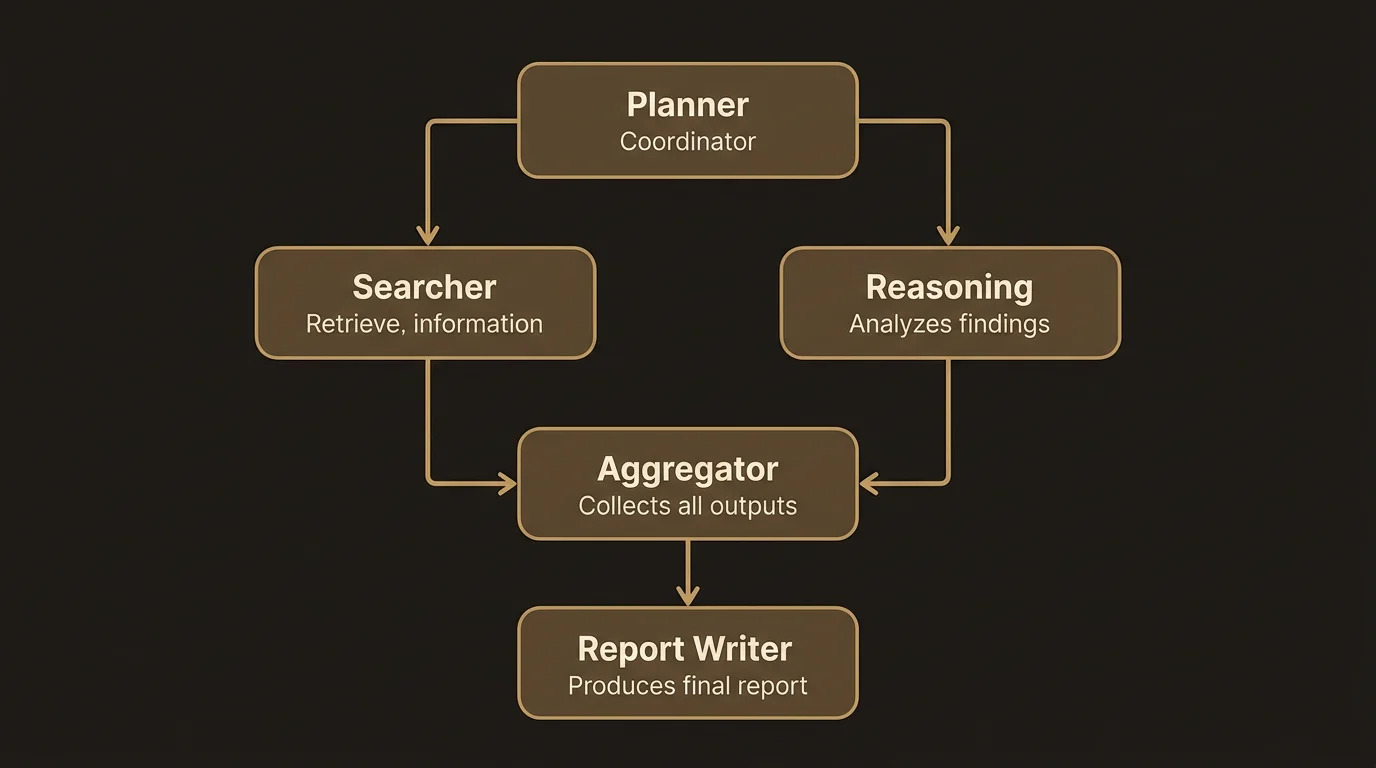
Every LumaVista project uses the same five agent types, each designed for a specific stage of the research process:
Planner
The planner reads your prompt and decides how to break it down. It produces a set of subtasks — specific questions or areas that need investigation to answer your overall research question. Each subtask becomes a child node in the graph.
The planner is budget-aware. It knows how many nodes it can create and how deep the graph can go, so it makes strategic decisions about where to invest research effort. A planner with a large budget might create four or five subtasks; one near its budget limit might create just two highly focused ones.
Planners can also appear at deeper levels of the graph. If a search or reasoning node determines that a subtopic needs further investigation, a new planner can break it down into additional subtasks. This is how the graph grows beyond the first level.
Searcher
Search agents go out and gather information. Each search node targets a specific aspect of your question, querying web sources and collecting relevant material. Search nodes are leaf nodes by default — they gather and return, they do not create children.
Reasoning
Reasoning agents analyze what the searchers found. They compare sources, identify patterns, spot contradictions, and draw conclusions. Like searchers, reasoning nodes are typically leaf nodes, though they can trigger further investigation if their analysis reveals areas that need deeper exploration.
Aggregator
Aggregators pull together findings from multiple search and reasoning nodes. If your research question was broken into four subtasks, the aggregator reads all four sets of findings and synthesizes them into coherent sections. It resolves conflicts between sources and builds a unified narrative.
Report writer
The report writer takes the aggregator’s output and produces the final structured report. It follows the section structure defined in your prompt (from the guided prompt builder or your own specification), adds citations, and ensures the report reads as a cohesive document rather than a collection of summaries.
How the graph grows
The research graph starts with a single planner node and expands outward as agents create subtasks. Here is the typical flow:
Depth 0 — Planning. The root planner reads your prompt and creates child nodes for each subtask it identifies.
Depth 1 — Searching and reasoning. Child nodes execute their assigned agent type. Searchers gather information; reasoning agents analyze it. If a node’s findings suggest that further investigation would be valuable, it can trigger additional expansion.
Depth 2+ — Deeper investigation. When a node triggers expansion, a new planner breaks that subtopic into further subtasks. This creates another level of depth. The graph can grow to several levels depending on your research profile and budget settings.
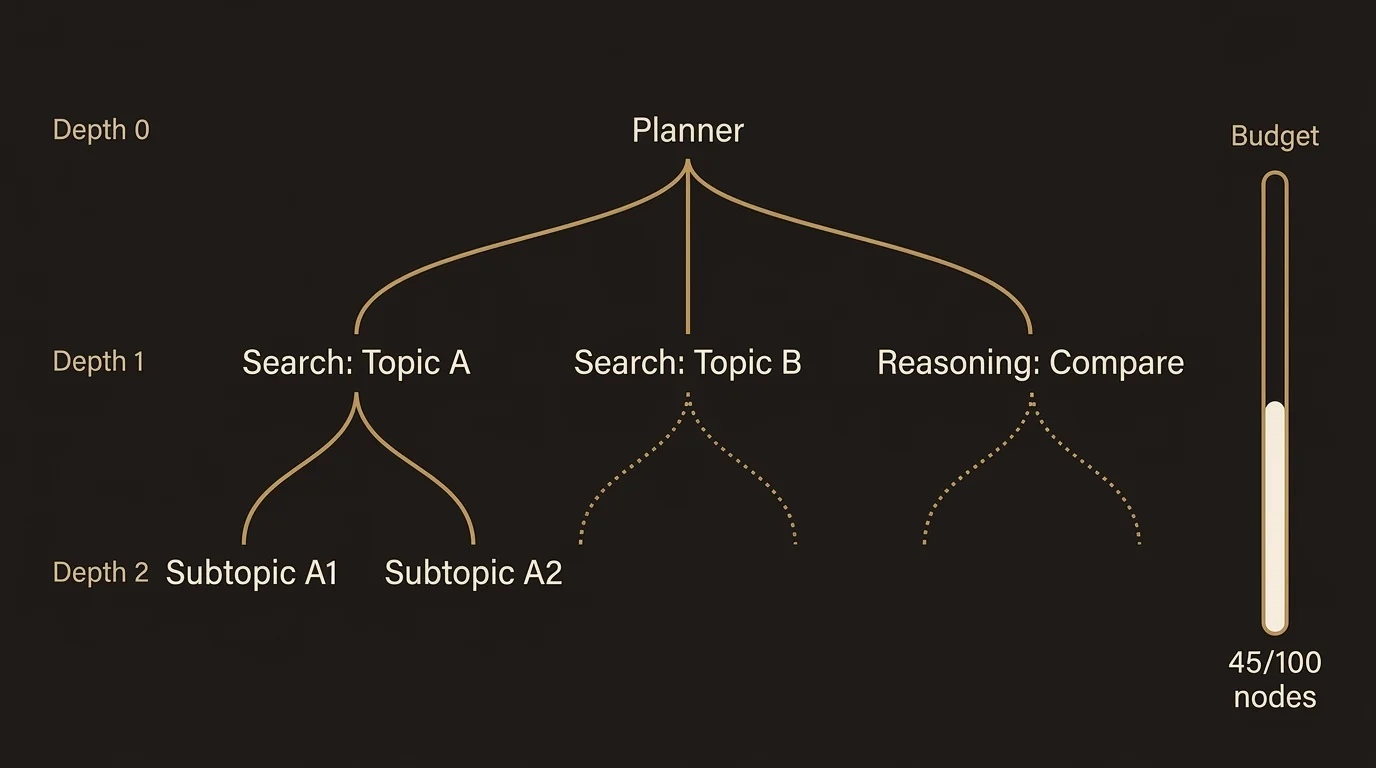
Each level of depth represents progressively more focused investigation. The first level breaks your question into major areas; the second level digs into specific aspects of those areas; a third level might investigate individual claims or data points in detail.
The budget system
Research is not free — each agent node consumes compute resources. LumaVista uses a budget system to ensure your research stays within bounds while still being thorough enough to be useful.
Node budget
The node budget is the total number of agent nodes your project can create. When the planner breaks your question into subtasks, it draws from this budget. Each subtask that spawns further investigation also draws from it. The budget prevents runaway expansion — without it, a complex question could spawn thousands of nodes.
Budget is distributed hierarchically. When a planner creates four children, it divides its remaining budget among them. Each child can then allocate its share to its own children. This ensures that resources are spread proportionally across the research, not consumed entirely by one subtopic.
Budget tiers
The planner adjusts its behavior based on how much budget remains:
| Tier | Remaining budget | Planner behavior |
|---|---|---|
| Large | 10+ nodes | Creates 3-4 subtasks, some can expand further |
| Moderate | 5-9 nodes | Creates 2-4 subtasks, limited expansion |
| Restricted | 3-4 nodes | Creates 2-3 mostly self-contained subtasks |
| Critical | Under 3 nodes | Creates 2 broad subtasks, no further expansion |
These tiers are automatic — you do not need to manage them. The planner sees its budget context and plans accordingly.
Depth limit
The depth limit caps how many levels deep the graph can grow. A depth limit of 3 means the graph can have a root planner, its children, and one more level of grandchildren. This prevents infinitely deep research chains.
Dollar budget
Separate from the node budget, the dollar budget tracks the actual cost of API calls made by each agent. If the dollar budget runs low, agents receive a signal to be more conservative in their approach — favoring concise reasoning over exhaustive analysis.
Extending the budget
If a project hits its budget limits but you want deeper research, LumaVista will ask you through the Human-in-the-Loop system. You can approve additional budget, increase the depth limit, or decline and let the project finish with what it has.
Reading the graph visualization
The graph view in the project interface shows nodes connected by edges:
Node states
- Queued — The node is waiting to run. It appears as a neutral-toned node.
- Running — The node’s agent is actively working. Indicated by an animated border.
- Completed — The agent finished successfully. The node shows a completion indicator.
- Failed — Something went wrong. Click the node to see error details.
- Needs expansion — The node’s output triggered a request for further investigation. Pending your approval if HITL is active.
- Pending children — The node is waiting for its children to complete before it can be finalized.
Node details
Click any node to see its details panel:
- Input — What the agent was asked to do.
- Output — What the agent produced (search results, reasoning, synthesized content).
- Agent type — Which kind of agent handled this node (planner, searcher, reasoning, aggregator, report writer).
- Cost — How much this node cost in compute resources.
- Timing — When the node started, how long it ran, and when it completed.
- Depth — How deep in the graph this node sits.
Graph layout
The graph flows top-to-bottom, with the root planner at the top and leaf nodes (searchers, reasoners) at the bottom. Edges show parent-child relationships. You can zoom and pan to navigate larger graphs. On mobile, use pinch-to-zoom and touch panning.
Post-execution expansion
Not all expansion comes from the planner. Sometimes a search or reasoning agent discovers something unexpected — a contradiction in sources, a gap in the research, or a new angle worth investigating. When this happens, the agent can request post-execution expansion.
The system detects expansion triggers in two ways:
- Explicit requests — The agent’s output directly indicates that further investigation is needed.
- Signal detection — The system scans the agent’s output for phrases that suggest a need for deeper exploration, like “requires further investigation” or “additional research needed.”
When a trigger is detected, the node transitions to a “needs expansion” state. If you have Human-in-the-Loop enabled, you will be asked to approve the expansion. If approved, a new planner is invoked to break the subtopic into further subtasks, and the graph grows from that point.
This is how LumaVista handles the unexpected — the research can adapt to what it finds, rather than being locked into the plan that was made before any searching happened.
Common graph patterns
After running a few projects, you will start recognizing patterns:
Wide and shallow — The planner creates many subtasks at depth 1, but few go deeper. This is typical for survey-style research (“give me an overview of X”) or when the budget is moderate.
Narrow and deep — The planner creates fewer subtasks, but they expand into deeper investigation. This happens with focused questions and deep research profiles.
Asymmetric — Some branches go deeper than others. This is the most common pattern for complex questions — some subtopics warrant more investigation than others, and the budget system allocates accordingly.
Related docs
- Guiding Your Research: Human-in-the-Loop — How to approve, reject, or batch-manage expansion requests
- Chatting With Your Research — Ask follow-up questions about your research findings