Graph-Based AI — Why the Best Research Looks Like a Map, Not a List
By LumaVista Team
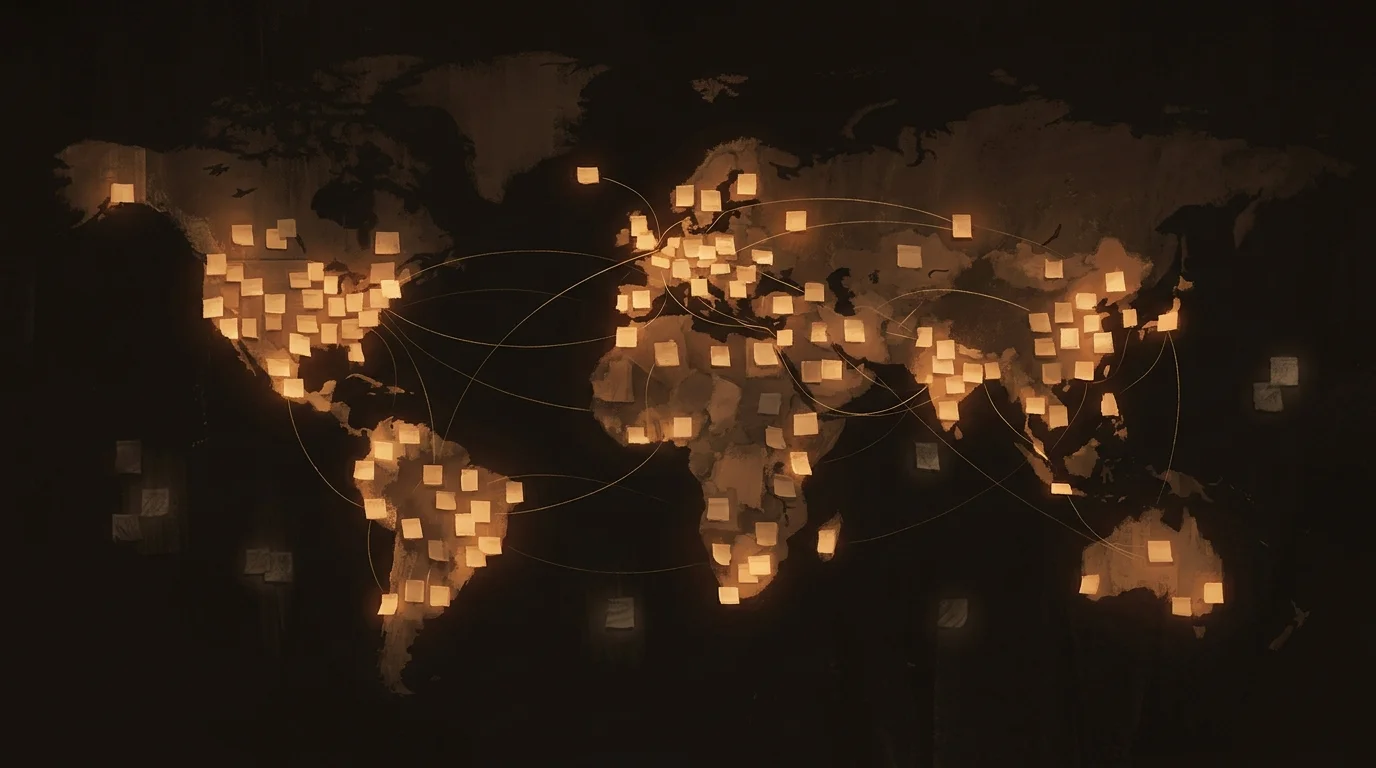
Picture a wall of sticky notes. Some are clustered by topic — yellow for market data, blue for regulatory findings, pink for competitor analysis. Arrows connect related findings across clusters. A few notes are crossed out because they led nowhere, but they’re still on the wall so you can see what was tried. There are scribbled annotations in the margins: “contradicts finding #7,” “need to verify with primary source,” “this changes the conclusion in cluster B.”
This is how a human researcher actually works. Not in a straight line — in a web. Parallel threads running simultaneously. Cross-references emerging as different threads produce results that inform each other. Dead ends explored and intentionally abandoned. The process is messy, branching, iterative, and rich.
Now picture how most AI tools work. You type a prompt. You get a response. One thread. No branches. No cross-references. No visible methodology. If you want to explore a tangent, you start a new conversation. If you want to connect findings from two different queries, you do it yourself — manually, in your head, or in a Google Doc.
That’s a list, not research.
The gap is structural. A human researcher produces better work not because they’re smarter than a language model at any individual step, but because their process has a shape that captures complexity. The sticky-note wall isn’t just a workspace — it’s a thinking structure that enables parallel exploration, cross-pollination, and visible methodology.
The best AI research should look like that wall of sticky notes. A map of interconnected inquiry, not a one-way street. And now it can.
The best AI research should look like a wall of sticky notes — a map of interconnected inquiry, not a one-way street.
Linear AI — the one-track mind
Most AI tools today follow the same basic pattern: one prompt goes in, one response comes out. One model, one pass, one thread of execution.
Even the tools that market themselves as “advanced” — the ones that search the web, cite sources, or use chain-of-thought reasoning — are fundamentally linear. They execute one step at a time, in sequence, down a single path. Search, then read, then summarize, then respond. If the first search query was poorly chosen, the entire chain suffers. If a promising lead appears in source number three that contradicts the conclusion forming from sources one and two, the model might not notice — it’s already committed to its trajectory.
It’s like asking a single junior analyst to research a complex topic. They’ll work through it sequentially and produce something. But they’ll miss connections between sources because they read them hours apart. They can’t pursue three promising leads simultaneously — they pick one and hope it’s the most productive. They can’t efficiently backtrack when a thread turns unproductive. And when they hand you the final report, you can’t see how they got there. Just the conclusion, no visible trail from question to answer.
This is the current state of AI research tools. One model, one pass, hope for the best. For simple questions, it’s fine. For anything with real complexity, it’s fundamentally insufficient.
What a DAG is — without the jargon
There’s a computer science concept that perfectly describes the research structure we want: a DAG. Directed Acyclic Graph. The name sounds intimidating, but the idea is three things:
Directed means tasks flow in one direction. You research before you analyze. You analyze before you synthesize. Information flows forward — from raw sources to processed findings to final conclusions. No going backwards.
Acyclic means no circular dependencies. You can’t write the conclusion before the analysis that informs it. No infinite loops, no tasks waiting on each other in a deadlock. The work moves forward and terminates.
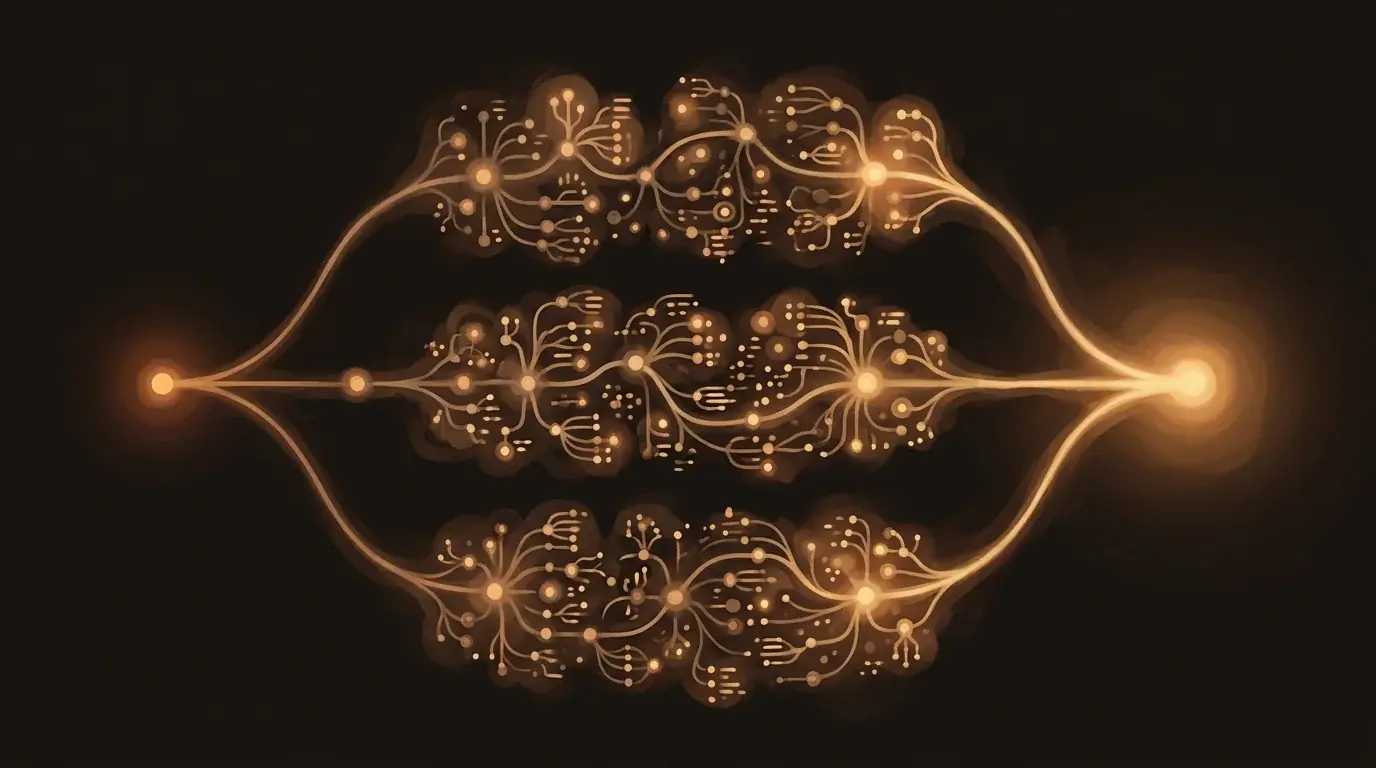
Graph means nodes connected by edges, not a straight line. This is the key part. A graph can branch: one node’s output feeds into multiple downstream nodes. A graph can converge: multiple outputs feed into a single node. Multiple independent paths running in parallel, only merging when their results are needed together.
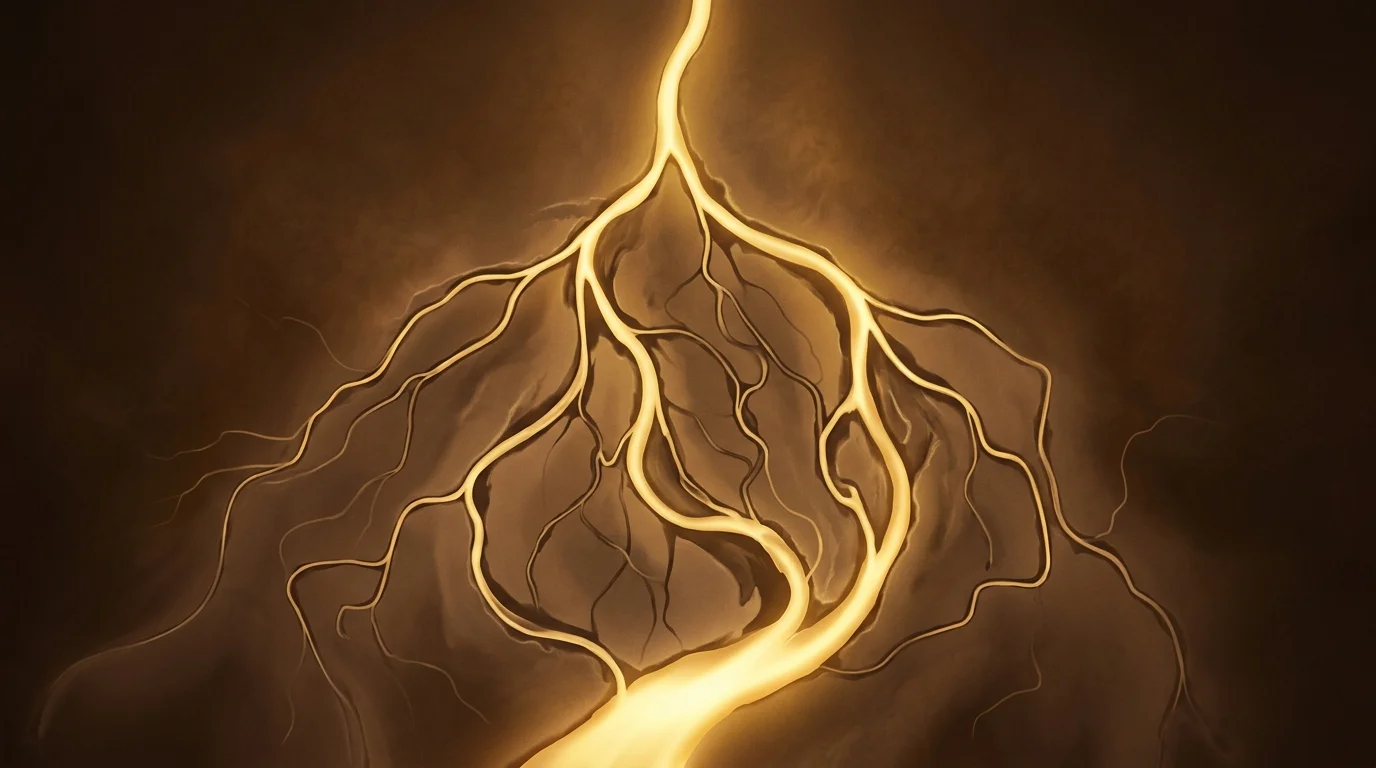
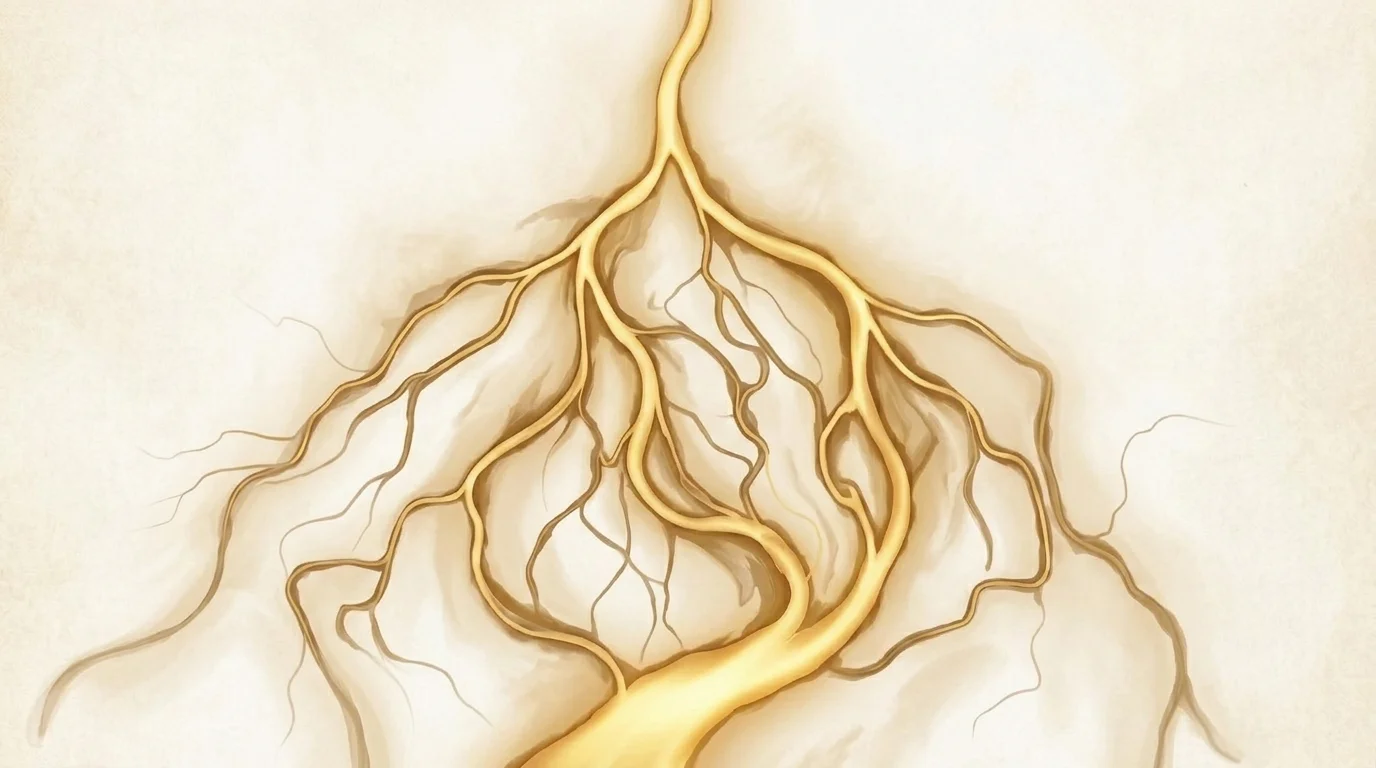
Think of it like a river delta. A single stream — your research question — enters from one side. It splits into many channels — your subtasks. Some channels are wide and deep, carrying the most important threads of inquiry. Some are narrow and peter out — dead ends that were correctly identified and abandoned. The channels branch and reconnect as findings from one thread inform another. Eventually, the channels merge back into a wider river — your synthesized report, informed by everything upstream.
Here’s the simplest possible example: you ask a question. A planner node receives it and creates three parallel research tasks. Each task runs independently — different searches, different sources, different analysis. A synthesis node sits downstream, waiting for all three to finish. Once they complete, it produces the report, informed by all three threads simultaneously.
That’s a DAG. Three times the research in the same wall-clock time. But simple DAGs are just the beginning. Real research graphs get much more interesting.
A graph can branch, converge, and expand. A list just keeps going in one direction and hopes for the best.
Five reasons graphs beat lists
Once you move from linear execution to a graph structure, five capabilities emerge that simply cannot exist in a linear pipeline.
1. Parallel execution
A graph can run multiple research threads simultaneously. Ask about the competitive implications of EU regulation, and the graph fires off three branches at once: one searching for regulatory provisions, one analyzing competitor strategies, one gathering market data. If the regulatory search takes twice as long — because the sources are dense and need careful parsing — the other two branches aren’t sitting idle. They’re already producing results. The total research time is bounded by the slowest branch, not the sum of all branches. For a research question that decomposes into five parallel threads, that’s the difference between five minutes and twenty-five.
2. Conditional branching
The graph isn’t static. A planner node can examine intermediate results and decide to expand the graph in real time. If the EU regulation search reveals that credit scoring AI is classified as high-risk under the AI Act, the planner can spawn a new sub-branch specifically about credit scoring compliance — timelines, penalties, technical requirements. If another branch is producing redundant results, the planner can prune it instead of wasting compute. Linear tools can’t do this. They committed to their plan at the start and execute it blindly, regardless of what they find along the way.
3. Cross-referencing
Results from one branch can trigger work in another. Finding that the EU AI Act classifies credit scoring as high-risk (branch A) doesn’t just expand branch A — it feeds into the market opportunity analysis (branch D). Firms that implement compliant AI credit scoring before their competitors gain first-mover advantage. That insight only exists at the intersection of two branches. In linear execution, you’d need a human to read both results and make the connection manually. In a graph, the synthesis node sees all branches and can identify connections automatically.
4. Recursive expansion
A planner node can spawn an entire sub-graph. When a research question turns out to be more complex than expected — “credit scoring compliance” is actually three distinct regulatory frameworks — the structure doesn’t break. It grows. The sub-graph has its own search, analyze, and synthesize pipeline, nested within the larger research structure like a fractal. The outer graph doesn’t need to know the details — it just receives the sub-graph’s synthesized output.
5. Transparency
You can see the research structure, not just the final output. The graph IS the methodology, visible and auditable in real time. Every branch is a visible line of inquiry. Every node shows its status: queued, running, complete, failed. Every edge shows why one task depended on another. You know exactly what was researched, in what order, with what results, and how those results connected to form the final conclusion. The methodology isn’t hidden inside a black box — it’s the structure itself.
Watch a question become a research graph
Let’s trace a concrete example from start to finish. The question: “What are the competitive implications of the EU AI Act for mid-size financial firms?”
This isn’t a simple lookup. It spans regulatory law, competitive strategy, compliance requirements, and market dynamics. A linear tool would try to tackle it in one pass. Here’s what happens in a graph.
Step 1 — Decomposition. A planner agent receives the question and analyzes it. This question has at least four distinct dimensions that can be researched independently. The planner creates four branches:
- (a) EU AI Act provisions specifically relevant to financial services
- (b) Current AI adoption and strategy among mid-size financial firms
- (c) Specific compliance requirements and timelines for mid-size firms
- (d) Market opportunity analysis — where does regulation create advantage?
Four nodes, ready to execute. Each one has a clear, focused research question.
Step 2 — Parallel execution. All four branches begin simultaneously. Each runs its own mini-pipeline: search for relevant sources, validate source reliability and relevance, analyze the findings. Branch (a) is pulling from legal databases and regulatory texts. Branch (b) is searching industry reports and news. Branch (c) is looking at compliance frameworks and consulting firm analyses. Branch (d) is searching for market data and analyst reports.
The graph now has twelve or more active nodes. All running concurrently.
Step 3 — Expansion. Branch (a) discovers that credit scoring AI is explicitly classified as “high-risk” under Annex III of the EU AI Act. The planner spawns a new sub-branch: credit scoring compliance requirements, timelines, and penalties. The graph grows organically, following the research where it leads.
Step 4 — Cross-reference. Findings from branch (a) — specific regulatory requirements and their timelines — are now available to branch (d). The market opportunity analysis incorporates a new insight: firms that implement compliant AI credit scoring systems before the 2025 enforcement deadline gain measurable first-mover advantage. Competitors who lag face both regulatory penalties and competitive disadvantage. This connection only exists because both branches ran and their results could be compared by a downstream node. No single linear pass would have surfaced it.
Step 5 — Synthesis. A synthesis node waits for all branches — including the expanded credit scoring sub-branch — to complete. It produces a structured report organized by the research dimensions: regulatory landscape, competitive positioning, compliance roadmap, and market opportunities. Each section is sourced from the relevant branch, with specific citations traceable back to individual search nodes. The synthesis identifies cross-branch connections and highlights the insights that emerged from their intersection.
The result: a research report with the depth and breadth of a multi-analyst project team, completed in minutes instead of days, with full source attribution and a visible methodology you can trace from question to conclusion. For more on how the individual agents within each node work, see how agentic AI differs from simple chat.
Insights that only exist at the intersection of two research branches will never surface in a linear pipeline. The graph is what makes cross-pollination possible.
The audit advantage
For personal research, a visible graph is nice to have. For regulated industries — financial services, healthcare, legal — it’s a compliance requirement.
Article 14 of the EU AI Act mandates human oversight of high-risk AI systems. Article 12 requires logging of system operations in a way that enables traceability. Article 13 requires transparency — users must be able to understand the AI system’s output. These aren’t suggestions. They’re legal requirements with enforcement teeth.
A DAG is inherently an audit trail. Every component of the research methodology is recorded in the structure itself:
- Every node records which agent ran, what model it used, what inputs it received, what outputs it produced, and how long it took.
- Every edge records the dependency — why this task ran after that one, and what data flowed between them.
- Every pruned branch records what was explored and abandoned, and why. You can see what was tried, not just what succeeded.
- The full graph persists after research completes. It can be revisited, re-examined, or re-run months later. When an auditor asks “how did you reach this conclusion?” — the answer is the graph itself.
If a conclusion is challenged — by a regulator, a client, or an internal review — you trace the graph backwards. Which sources informed the synthesis? Which searches found those sources? What query terms were used? The answer is right there in the structure. No black box. A full, traceable chain from question to conclusion.
For a deeper look at how the EU AI Act specifically impacts AI-assisted research tools, see our analysis of the EU AI Act and research tool compliance.
LumaVista’s research graph
LumaVista’s engine is a DAG. Not metaphorically — literally. Every research project you run is a directed acyclic graph executed in real time.
Nodes are agent tasks. A planner agent decomposes your question into subtasks. Searcher agents find information across the web. Reasoning agents analyze findings, identify patterns, and evaluate source reliability. Report writers synthesize results into structured narratives. Aggregators combine outputs from multiple branches into coherent wholes. Each node type is purpose-built for its role in the research pipeline.
Edges are dependencies. The reasoner waits for the searcher. The writer waits for the reasoner. The aggregator waits for all its input branches. These dependencies are explicit and visible — you can see exactly what’s waiting on what.
You watch the graph expand in real time as agents work. Each node’s status is visible: queued, running, complete, or failed. When a planner decides to expand the graph — adding a new research branch because an interesting finding emerged — you see the new nodes appear and begin executing. Human-in-the-loop checkpoints let you pause at any node and redirect: “go deeper here, skip that branch, add a new question I hadn’t thought of.”
Budget controls keep the graph from expanding indefinitely. You set a ceiling, and the planner respects it — prioritizing the most promising branches when resources are constrained. And because each node can use a different model — fast and inexpensive for search queries, powerful and deliberate for complex reasoning — you get both cost efficiency and research quality. For the full argument on why multi-model matters, see why one model isn’t enough. And for how neuroscience research is improving how these graph nodes coordinate, see our BIGMAS analysis.
The graph persists after the project completes. Want to revisit last month’s regulatory analysis with updated data? Re-run the search nodes; the analysis and synthesis structure is already there, ready to process new inputs through the same methodology.
A DAG is inherently an audit trail. The methodology is not hidden inside a black box — it is the structure itself.
Research that shows its work
The best research looks like a map because real thinking is never linear. It branches when a question has multiple dimensions. It converges when separate threads produce findings that inform each other. It backtracks when a promising lead turns out to be a dead end. It connects when an insight in one domain has implications for another.
Linear AI tools force complex thinking into a simple structure and lose everything that makes research valuable. Graph-based AI makes that structure explicit, visible, and auditable. Not a better answer — a better process for finding the answer. One you can watch, redirect, and verify.
LumaVista turns every research question into a visible research graph. Watch your question decompose into subtasks, execute in parallel, cross-reference findings across branches, and synthesize — all in real time. Research that shows its work. Start your first research graph today.